
Written by: Nimesh Chakravarthi, Co-founder & CTO, Struct | Last updated: July 5, 2026
Key Takeaways for Engineering Leaders
- Automated root cause analysis uses machine learning to identify failures without manual data correlation across multiple tools.
- Acerta LinePulse follows a five-step workflow: data ingestion, failure definition, feature selection, signal ranking, and iterative investigation.
- Software teams face similar RCA challenges as manufacturing but need platforms built for logs, traces, deployments, and observability data instead of physical sensors.
- Struct reduces triage time by 80%, cutting 30–45 minute manual investigations down to 5–10 minutes while supporting junior engineers on call.
- Teams can automate their on-call runbook with Struct and receive instant, contextual root cause analysis the moment an alert fires.
The On-Call Investigation Loop That Burns Your MTTR
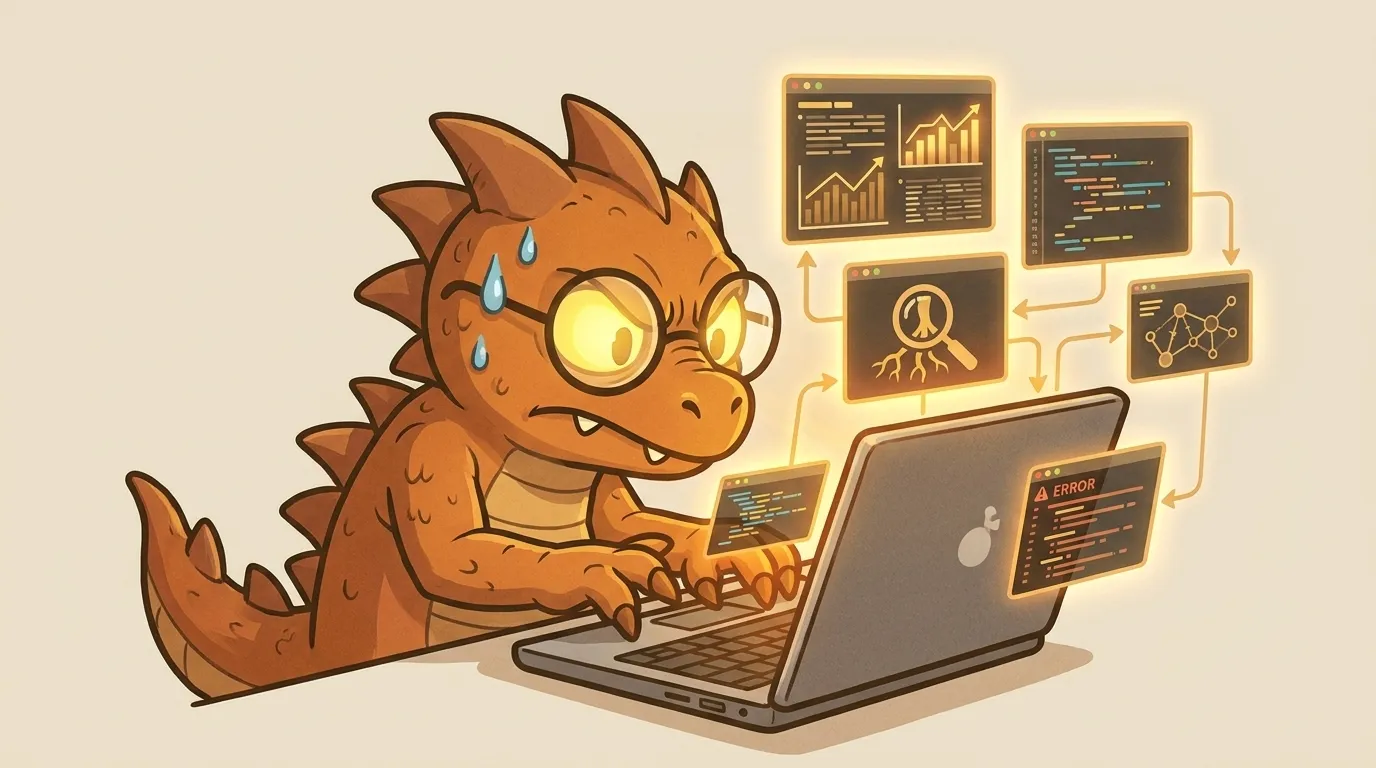
At 3 a.m., an alert fires. An engineer opens their laptop and repeats the same manual sequence: acknowledge the alert in PagerDuty, check Datadog for anomalous metrics, pull exceptions from Sentry, cross-reference a recent GitHub commit, and search Slack for any prior context. Industry data shows that manual investigation still consumes 60–80% of total MTTR in distributed systems. The result is a 30–45-minute triage window that repeats every time an alert fires, regardless of severity.
Automated RCA exists to remove this repetitive investigation loop, whether the system under observation is a CNC machine or a distributed microservices architecture.
Acerta LinePulse’s Five-Step Automated Root Cause Workflow
Acerta LinePulse is a manufacturing analytics platform that applies machine learning to production-line sensor data. Its automated RCA workflow follows five discrete steps.
- Continuous data collection and semantic mapping. LinePulse ingests time-series signals from sensors, PLCs, and production systems in real time and maps each signal to a semantic label within the process model. This step runs continuously and forms the foundation for all downstream analysis.
- Engineer-defined failure parameters. A domain engineer specifies what constitutes a failure event, such as a defect rate threshold, a dimensional tolerance breach, or a quality-control rejection. This labeled target variable anchors the machine learning model to a meaningful outcome rather than an arbitrary statistical deviation.
- Automatic feature selection and model training. LinePulse evaluates the full signal library against the defined failure parameter, applies feature selection algorithms to eliminate low-information variables, and trains a predictive model on historical production data. The model learns which combinations of process signals precede the failure event.
- Ranked signal output. The trained model produces a ranked list of contributing process signals ordered by their statistical contribution to the failure. Engineers receive a prioritized view of which variables, such as spindle speed, coolant temperature, or feed rate, are most strongly associated with the defect.
- Iterative investigation. Engineers review the ranked output, validate physical causality, adjust failure parameters or signal scope, and retrain the model. The loop continues until the causal chain is confirmed and a corrective action is defined.
From Overview to Detail: How LinePulse Ingests Manufacturing Data
Now that the complete workflow is outlined, the first step to examine in detail is data ingestion. LinePulse ingests structured time-series data from manufacturing equipment, including sensor readings, PLC outputs, quality inspection records, and production metadata. Each signal must be timestamped, consistently sampled, and tagged with a process identifier before the platform can map it semantically. AI root cause analysis systems require structured, labeled input data, and AI-enabled monitoring systems scan sensor data, maintenance logs, and production records in real time and automatically trigger RCA when anomalies occur.
If sensor data is missing, irregularly sampled, or unlabeled, the model cannot establish reliable correlations. Data quality functions as a hard prerequisite, not a soft recommendation.
How Acerta Ranks Contributing Process Signals
Signal ranking in LinePulse relies on the statistical relationship between each process variable and the engineer-defined failure label. The platform applies feature importance scoring, using methods such as gradient boosting importance or permutation-based ranking, to order signals by their predictive contribution. Modern RCA software automates signal correlation across logs, metrics, and traces while using AI to rank hypotheses and surface probable root causes.
The ranked output is a probability-weighted list, not a deterministic causal proof. A signal ranked first is the strongest statistical predictor of the failure under the current model. It is not guaranteed to be the physical root cause without engineer validation.
Where Acerta’s Automated RCA Hits Its Limits
Three limitations apply consistently to LinePulse’s automated RCA workflow and to manufacturing-focused ML platforms generally.
- Engineer validation is mandatory. AI causal RCA does not replace human validation of causality or ownership of the postmortem, and correlation provides a strong prior while humans confirm root causes and decide on prevention actions. AI identifies correlations, not causation, so engineers must confirm which signals truly caused the failure and which actions prevent recurrence. A ranked signal therefore functions as a hypothesis that guides investigation, not as a final verdict.
- Data quality gates the output. Machine learning models identify correlations between variables to generate predictive root cause insights, but only when the underlying data is clean, complete, and consistently labeled. Sparse or malformed sensor data produces unreliable rankings and weak guidance for corrective action.
- Domain-specific scope. LinePulse is architected for physical process signals. It has no native mechanism for ingesting software telemetry such as distributed traces, exception stack traces, deployment events, or log streams from cloud infrastructure. Software engineering teams therefore cannot apply it directly to their stack.
Where Automated RCA Sits in Engineering Operations
Automated RCA occupies the same phase in the incident lifecycle for both production lines and distributed applications. RCA is the diagnose phase within a five-phase incident lifecycle: detect, triage, diagnose, remediate, and learn. In software operations, the diagnose phase connects alert triggers from observability platforms to ticketing systems and on-call workflows.
Agentic RCA systems gather evidence across systems, run queries, refine hypotheses, and produce a ranked causal chain. These systems integrate with the same tools engineers already use rather than forcing a separate investigation environment.
Observability solutions use machine learning to automate RCA by scanning logs backward to detect known problem indicators and anomalies, then applying generative AI to correlate rare indicators against knowledge bases and an organization’s unique environment. This behavior mirrors LinePulse’s continuous data collection and semantic mapping step for software systems.
Comparing Acerta’s Steps to Software Telemetry and Struct
| Step | Acerta Manufacturing Source | Software Equivalent | Struct Automation |
|---|---|---|---|
| 1. Continuous data collection & semantic mapping | PLC sensor streams, quality inspection records | Logs (CloudWatch, GCP, Datadog), traces (Azure, Datadog APM), exceptions (Sentry) | Struct ingests live telemetry from Datadog, AWS CloudWatch, GCP, Azure, Sentry, and GitHub the moment an alert fires. |
| 2. Engineer-defined failure parameters | Defect rate threshold, dimensional tolerance breach | Alert rule in PagerDuty or Slack channel trigger | Teams configure Struct to listen to specific Slack channels or ticketing systems (Linear, Jira, Asana), and custom runbooks encode exact failure definitions. |
| 3. Automatic feature selection & model training | Feature importance scoring across process signal library | Parallel correlation across logs, metrics, traces, and deploy events | AI RCA agents query logs, metrics, traces, and the deploy pipeline simultaneously, scoped to the incident’s service and time window. Struct executes this correlation phase in under 5 minutes. |
| 4. Ranked signal output | Probability-weighted list of contributing process variables | Ranked hypotheses with provenance across services and dependencies | Struct outputs impact assessment, root cause, and suggested fixes in a dynamically generated dashboard with supporting evidence and a unified timeline. |
| 5. Iterative investigation | Engineer validates physical causality, adjusts parameters, retrains | Engineer confirms root cause, tests alternative hypotheses, drafts postmortem | Slack-native conversational AI allows engineers to ask follow-up questions, pull additional logs, or test alternative hypotheses without leaving the alert thread. |
Measuring MTTR, Triage-Time Reduction, and Onboarding Speed
The business case for automated RCA in software engineering rests on measurable reductions in diagnosis time. AI-powered investigation tools can reduce the time to first actionable hypothesis from tens of minutes to just a few minutes by analyzing logs, metrics, traces, deployments, and historical incidents in parallel. AI-assisted workflows consistently reduce MTTR by compressing the diagnose phase.
Struct’s production outcomes align with these benchmarks. Production data confirms the 80% triage reduction outlined earlier, with teams consistently compressing their investigation phase to under 10 minutes. A Series A fintech with over 40 engineers completed the setup process and achieved this same reduction in their context-gathering and investigation phase, protecting strict SLA windows and enabling junior engineers to manage on-call shifts independently. Organizations using AI for incident management commonly see 40–70% MTTR reduction within 6–18 months when paired with process changes and data centralization.
Frequently Asked Questions About Struct for Automated RCA
What minimum tooling maturity does a team need before Struct delivers accurate root causes?
Struct requires that a team already uses at least one observability or logging platform such as Datadog, AWS CloudWatch, GCP Logs, or Azure, one exception tracker such as Sentry, and one alert delivery channel such as Slack or PagerDuty. GitHub integration adds code context. If a team lacks basic logging, trace IDs, or alert triggers, Struct cannot deduce system state from code analysis alone.
Teams with these foundations in place, even at a basic level, can connect integrations and run their first automated investigation in under 10 minutes.
How long does it take to set up Struct, and does it require dedicated engineering time?
Setup takes 10 minutes. Engineers authenticate their alert source such as Slack or a ticketing system, their code repository such as GitHub, and their observability context such as Datadog or CloudWatch. Once connected, auto-investigations activate immediately.
No professional services engagement, multi-week deployment, or dedicated implementation engineer is required.
Is Struct compliant with SOC 2 and HIPAA requirements?
Struct is fully SOC 2 and HIPAA compliant. Log data is accessed and processed ephemerally, and it is not stored persistently by Struct. This compliance posture covers the requirements of the majority of Seed to Series C companies, including fintech and healthcare-adjacent organizations with strict data handling mandates.
Teams that require full on-premise deployment with zero data egress from their VPC are not currently a fit for Struct’s cloud-based architecture.
Can Struct be configured to follow a team’s existing on-call runbook?
Struct can mirror a team’s existing on-call runbook. Teams can input custom instructions, correlation ID formats, and their internal on-call runbook directly into Struct. The platform’s composable widget architecture also allows builders to specify which data visualizations and log queries are always surfaced for particular alert types.
When an alert fires, Struct follows those encoded procedures exactly and produces outputs that match how a senior engineer on that team would investigate the same issue.
How does Struct help junior engineers take on-call shifts safely?
Struct performs the initial investigation automatically before an engineer opens their laptop. The output, which includes impact assessment, root cause, supporting evidence, and suggested fixes, gives junior engineers a fully contextualized starting point for every alert.
Instead of relying on tribal knowledge of the system’s history and architecture, a junior engineer reviews Struct’s findings, validates the hypothesis, and proceeds to remediation. This approach removes the senior-engineer bottleneck that typically prevents new hires from owning on-call rotations.
Conclusion: Matching Automated RCA to a Software Stack
Acerta LinePulse shows that automated RCA follows a mature, five-step engineering discipline: ingest data continuously, define failure targets, select and train on relevant features, rank contributing signals, and iterate with human validation. The workflow is sound, but the scope is narrow because LinePulse is built for physical manufacturing signals, not distributed software telemetry.
Software engineering teams face the same analytical problem with different data sources, such as logs instead of sensor streams, deployment events instead of machine parameters, and exception traces instead of dimensional measurements. Graph-based automated RCA approaches model services, dependencies, changes, and tickets as connected entities, enabling queries for upstream changes, event paths, and affected components without manual stitching of context across tools. Struct applies this same five-step logic natively to software telemetry, delivering root causes in 5–10 minutes with an 85–90%+ helpful investigation rate and a 10-minute setup.
Teams evaluating automated RCA for software incidents do not need to adapt a manufacturing tool. They need a platform purpose-built for their stack.
