
Written by: Nimesh Chakravarthi, Co-founder & CTO, Struct
Key Takeaways for Software Teams
- TapRooT-style root cause analysis gives software teams a structured, blame-free six-step framework that turns chaotic incident timelines into repeatable postmortems using logs, traces, and observability data.
- The process adapts industrial TapRooT tools like SnapCharT timelines and Root Cause Trees directly to software environments, replacing interviews with immutable telemetry for faster and more honest analysis.
- Each step, from defining precise incident objectives to generating SMART corrective actions and verifying fixes with canary releases, maps onto tools like Datadog, Sentry, GitHub, PagerDuty, and Slack.
- Manual RCA works for infrequent incidents but fails with high alert volume or junior-heavy teams; AI-assisted correlation reduces triage time by 80% and delivers root cause context before engineers open their laptops.
- Struct automates the first 80% of evidence-gathering work so you can compress triage from 30 minutes to under five and move from alert to root cause before your coffee cools.
Why TapRooT Needs a Software-Native Translation
TapRooT started in industrial safety investigations with field interviews, paper timelines, and physical evidence. Software incidents move faster and generate far more signal. Root cause analysis for complex production incidents can take several hours, with early time often spent aligning on what is broken instead of fixing it. That delay reflects a correlation problem, not a lack of data.
Structured, blame-free analysis directly reduces recurrence. The Google SRE Book advocates blameless postmortems to learn from mistakes and avoid assigning blame. When engineers fear blame, they under-report contributing factors, and the same failure mode resurfaces weeks later. A software-adapted TapRooT process replaces interviews and paper timelines with immutable telemetry, which makes the analysis faster and more honest.
See Struct deliver root cause context automatically before your engineer even opens their laptop.
Step 1: Define the Incident Objective and Current State
Clear objectives keep investigations focused and prevent scope creep. Every TapRooT investigation starts with a precise objective statement. In software, that means converting a raw alert into a scoped problem definition before any log-hunting begins.
Inputs: PagerDuty or Slack alert, SLO breach notification, error budget burn rate.
Output: A one-sentence objective. For example, “p99 latency on the checkout service exceeded 2,000 ms for 12 minutes starting at 03:14 UTC, breaching the 500 ms SLO.”
Trade-off: Spending two minutes on a precise objective statement saves 20 minutes of unfocused log searching. Skipping this step allows the investigation scope to drift across unrelated services.
Step 2: Build a Software SnapCharT Timeline
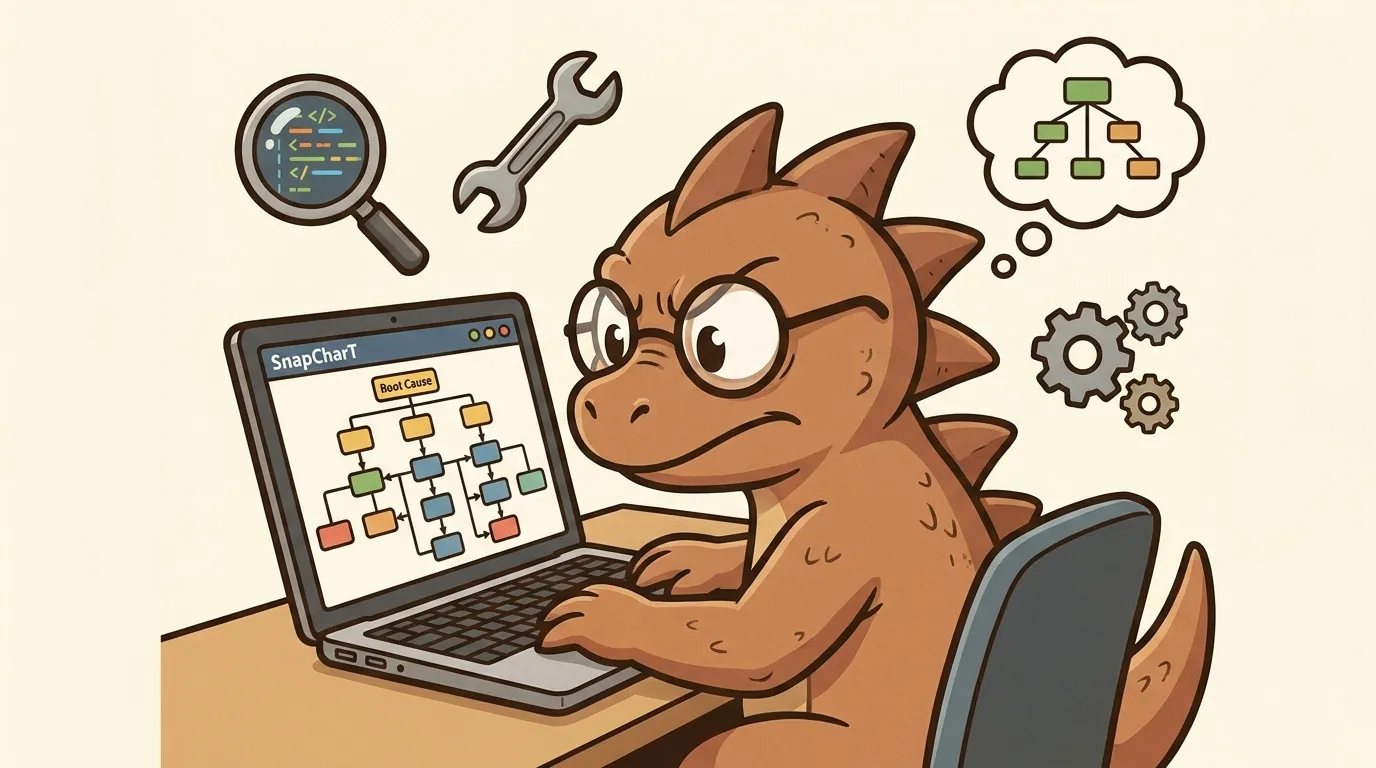
A SnapCharT timeline aligns every observable fact on a single clock so patterns become obvious. TapRooT’s SnapCharT is a sequential event chart that places each event in order. For software incidents, those facts come from structured telemetry rather than witness interviews.
Inputs: Distributed trace IDs, log timestamps, deployment records, Git commit SHAs, alert fire times.
Output: A unified timeline with each event tagged to a service, actor (human or automated), and timestamp. Download the SnapCharT template for software incidents to get started.
Teams record events, alerts, changes, and investigator actions in a single chronological view to support accurate post-incident analysis. Pull that data from your observability platform, then move into causal analysis with a complete picture of what happened.
SnapCharT for Software Incidents in Practice
Timeline analysis reconstructs the exact sequence of events, deploys, config changes, and alerts on a single clock to reveal when a healthy system became unhealthy. The following worked example highlights a critical pattern: a deploy at 02:58 UTC triggers a cascade of downstream effects that only surface as an alert 16 minutes later. That lag between root cause and detection is exactly what a SnapCharT built from telemetry exposes.
Worked example — checkout service latency spike:
- 02:58 UTC, GitHub Actions deploys
checkout-service v2.4.1, and the commit diff shows a new synchronous call to the inventory microservice added to the critical path. - 03:01 UTC, Datadog APM shows p99 latency on
inventory-serviceclimbing from 80 ms to 420 ms, but no alert fires yet. - 03:09 UTC, Sentry captures
TimeoutExceptiononcheckout-service, and trace IDabc-1234links the exception to the inventory call. - 03:14 UTC, an SLO burn rate alert fires in PagerDuty, and the on-call engineer gets paged.
- 03:14–03:44 UTC, a 30-minute manual triage window unfolds without automation.
Causal discovery pipelines ingest the full telemetry window of an incident, overlay manual timelines with deploy and config events, and output a validated causal graph plus recommended remediation actions. A software SnapCharT built from structured observability data provides the same foundation for human or automated analysis.
Step 3: Map Causal Factors with the TapRooT Root Cause Tree
The Root Cause Tree turns a noisy incident into a structured set of contributing factors. TapRooT’s Root Cause Tree organizes causal factors into five categories: Procedures, Training, Communications, Human Engineering, and Management System. Each category maps directly to common software engineering failure modes.
- Procedures: Missing or outdated runbooks, and no canary release policy for the affected service.
- Training: Engineer unfamiliar with the downstream latency impact of synchronous inter-service calls.
- Communications: No Slack notification sent when the deployment completed, so the on-call engineer remained unaware of the change.
- Human Engineering: CI pipeline lacked a latency regression gate, and the change passed all unit tests.
- Management System: No SLO alerting configured for the inventory service independently of checkout.
AI SRE correlation engines combine temporal correlation of events happening around the same time, topological correlation of events across dependent services, and semantic correlation of similar error messages to group related alerts. Mapping those correlations to Root Cause Tree categories converts raw signal into structured, actionable findings.
TapRooT Root Cause Tree Applied to the Example
Continuing the worked example, the Root Cause Tree analysis produces the following findings from three data sources. Each source reveals a different layer of the failure. Datadog shows when performance degraded, Sentry shows where the failure occurred in the call chain, and GitHub exposes why the code was vulnerable.
- Datadog APM graph: p99 latency on
inventory-servicerose 425% in the 11 minutes following the deploy, which maps to Human Engineering (no latency gate in CI). - Sentry exception:
TimeoutExceptionwith trace IDabc-1234confirms the checkout-to-inventory call as the proximate failure point, which maps to Procedures (no circuit breaker configured). - GitHub diff for
v2.4.1: SynchronousgetInventoryStatus()was added without a timeout parameter, which maps to Training (engineer unaware of timeout requirements for cross-service calls).
Timeline-based RCA in software environments distinguishes proximate cause, such as a pod being OOM-killed, from root cause, such as a memory leak shipped in a deploy without canary testing. That distinction ensures prevention actions target systemic conditions rather than symptoms.
Step 4: Turn Findings into SMART CI/CD Actions
Corrective actions only work when they are specific and live where engineers work. TapRooT corrective actions must be Specific, Measurable, Attainable, Relevant, and Timebound. In software, they must also sit inside CI pipelines, runbooks, or feature flag configurations.
Inputs: Root Cause Tree findings, current CI/CD pipeline configuration, runbook inventory.
Outputs — three SMART actions from the worked example:
These three actions create defense in depth. The CI gate blocks similar issues before deploy, the circuit breaker limits damage if one slips through, and the runbook update speeds triage when containment alone is not enough.
- Add a p99 latency regression gate to the
checkout-serviceGitHub Actions workflow that fails the build if inventory call latency exceeds 200 ms in the staging load test. Owner: platform team. Due: next sprint. - Add a 500 ms timeout and circuit breaker to
getInventoryStatus(). Owner: checkout team. Due: hotfix within 24 hours. - Update the on-call runbook to include an inventory service latency dashboard link as a mandatory first check for checkout SLO breaches. Owner: SRE lead. Due: before the next on-call rotation.
After implementation, organizations review corrective action effectiveness through follow-up checks that confirm reduced recurrence, then update risk levels per ISO 9001:2015.
Step 5: Verify Fixes with Canary Releases and Checks
Fixes only count once production data confirms them. Canary releases and automated checks convert corrective action hypotheses into evidence.
Validation methods:
- Deploy the circuit breaker fix to 5% of traffic via a feature flag, and monitor Datadog APM for p99 latency normalization before full rollout.
- Run the new CI latency gate against the last 10 deploys in a dry-run mode to confirm it would have caught
v2.4.1. - Trigger a synthetic checkout transaction in staging and verify the
TimeoutExceptionno longer appears in Sentry.
Expected output: p99 latency returns to baseline (under 500 ms) within one canary cycle, zero TimeoutException events appear in the next 24-hour production window, and the CI gate blocks a deliberately introduced regression in a test branch.
Step 6: Know When to Use an Automated RCA Platform
Manual TapRooT-style RCA works when incidents are infrequent and the team has deep systemic context. That model breaks down as teams scale, typically along three dimensions. First, alert volume outpaces human bandwidth, so the same senior engineers who could thoughtfully analyze five incidents per month cannot maintain quality across fifty.
Second, tribal knowledge becomes a bottleneck when it concentrates in two or three people, which turns every incident into an escalation chain. Third, new hires cannot safely take on-call shifts because the manual process assumes context they do not yet have, which reinforces the tribal knowledge problem.
AI SRE agents generate hypotheses from cross-stack data rather than matching known signatures, while humans retain final governance and approval authority. That split-responsibility model represents a practical evolution of TapRooT for software teams. AI handles evidence gathering and causal graph construction, and engineers make the final call on corrective actions.
Organizations commonly report 30–60% MTTR reductions from AI-assisted log analysis, with gains concentrated in the triage phase. A Series A fintech with over 40 engineers moved from a 30–45 minute manual triage window to automated root-cause dashboards in under five minutes after deploying Struct, achieving the triage compression mentioned earlier.
Struct gets you from alert to root cause before you even open your laptop, integrating directly with Slack, PagerDuty, Datadog, Sentry, GitHub, and cloud log providers to deliver a correlated timeline, blast radius assessment, and suggested fixes automatically the moment an alert fires.
See it in action and book a 30-minute demo to watch Struct analyze a live incident from your own alert data.
Frequently Asked Questions
What minimum tooling maturity is required to run this process?
Teams need three foundations before a software-adapted TapRooT process delivers reliable results. They need structured logging with consistent request or trace IDs, at least one observability platform that captures metrics and alerts (Datadog, Grafana, CloudWatch, or equivalent), and deployment records that timestamp every release to production. Without trace IDs, the SnapCharT timeline cannot link log events across services. Without deployment timestamps, the Root Cause Tree cannot distinguish a code change from a traffic anomaly.
Teams that lack these foundations should instrument trace IDs and deployment notifications before investing in structured RCA. Struct’s golden user profile is a team already using Sentry or a cloud log provider alongside a metrics platform and Slack for alerts.
How does Struct handle data residency and compliance requirements?
Struct is SOC 2 and HIPAA compliant. Logs and telemetry are accessed and processed ephemerally, and they are not stored beyond the investigation window. For the majority of Seed-to-Series-C companies, this compliance posture covers their contractual and regulatory obligations. Teams with strict enterprise requirements that mandate no logs leave their VPC or require full on-premise deployment should evaluate whether Struct’s current architecture fits their constraints before proceeding with a pilot.
Can junior engineers safely participate in TapRooT-style postmortems?
Junior engineers can participate safely, and structured RCA is designed to make that participation productive rather than anxiety-inducing. The blame-free framing of TapRooT means causal factors are attributed to systems, processes, and conditions, not individuals. Junior engineers contribute by documenting what they observed during the incident, which feeds directly into the SnapCharT timeline.
Struct accelerates their participation further by delivering a pre-built timeline, blast radius summary, and root cause hypothesis before the postmortem meeting begins. That starting point removes the tribal knowledge barrier that typically forces new hires to defer to senior engineers for every on-call shift.
What happens if logging and telemetry quality is poor?
Structured RCA, manual or automated, depends on the quality of the signals it ingests. If services emit unstructured logs without consistent request IDs, if deployments are not recorded with timestamps, or if no alerting triggers exist, the SnapCharT timeline will have gaps that make causal inference unreliable. The practical fix is incremental. Add trace ID propagation to the two or three highest-traffic services first, configure deployment notifications to a shared Slack channel, and enable error tracking in Sentry for the services most frequently involved in incidents.
Each improvement directly increases the fidelity of the next postmortem. Struct will surface what it can from available data, but it cannot synthesize causal chains from absent telemetry.
Conclusion: Scale TapRooT With Automation
TapRooT-style root cause analysis gives software teams a repeatable, blame-free framework that converts chaotic incident timelines into structured findings and preventive actions. The six steps, define the objective, build a SnapCharT from observability data, identify causal factors with the Root Cause Tree, generate SMART corrective actions, verify fixes through canary releases, and decide when automation takes over, map directly onto the tools on-call engineers already use, including Datadog, Sentry, GitHub, PagerDuty, and Slack.
Manual execution of this process is achievable for a small number of incidents. Scaling it across dozens of alerts per month, with a rotating on-call team that includes engineers new to the codebase, requires automation. Struct compresses the first 80% of evidence gathering into minutes, delivers a correlated timeline and root cause hypothesis before the engineer is fully awake, and encodes your team’s specific runbooks so every investigation follows the same structured logic your senior engineers would apply.
Start automating your runbook today and set up Struct in under 10 minutes so the next alert can investigate itself.
